Key words: Analytical; analysis; chemical; chemistry; education; environment; environmental; instrumentation; monitoring; training; water; water quality


For advice on and training in scientific methods for environmental monitoring
Site still under construction
Natural waters all contain a certain amount of dissolved material, although the nature of the solutes and their concentrations will vary according to the location of the water body. Thus a river running through a limestone catchment area will contain high concentrations of calcium and hydrogen carbonate ions but little organic matter. A moorland stream, however, may contain significant amounts of humic acids derived from decaying peat; it will certainly contain very little in the way of inorganic material. Similarly, the most abundant ions in sea-water generally are sodium and chloride, yet in inland waters these are comparatively minor constituents.
The inorganic solutes in natural waters are primarily ionic and, since ions are charged particles they can, if mobile, conduct an electric current. Thus it follows that their presence as solutes causes natural waters to be electrolytes; an electrolyte being a solution which can conduct electricity. The ability of a solution to conduct an electric current is determined by the concentrations and natures of the ions present. Consequently, measuring the conductivity of a water sample gives some indication of the amount of dissolved inorganic solids present. Water authorities and the NRA routinely measure the conductivity of waters for this reason since the amount of total dissolved solids (TDS) can itself be indicative of water quality. Determining the conductivity of water samples is quick and easy; also, it is possible to automate the measurements and have the readings recorded on a data logger for subsequent interrogation.
In areas where appreciable amounts of sodium chloride are likely to be present, either in water bodies or in the soil, then conductivity measurements can be adapted to record salinities.
These are but two of the uses to which conductivity measurements can be put, a more complete list is given below:
Checking water quality.
Tracking the route by which certain types of effluent enter a river, or other types of waterway.
Soil chemists use conductivity to determine the total salinity of soil extracts.
In ion-chromatography certain types of detector use conductivity measurements to detect ions eluting from the column.
Conductivity meters are incorporated into deionisers to check performance.
2. Conductivity and Water Quality
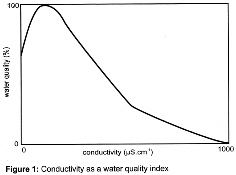
The relationship between conductivity and water quality is not straightforward and depends, to a certain extent, on the nature of the catchment area, the hardness of the water and the nature of the dissolved ions present. However, some years ago the Solway and Tweed River Purification Boards in Scotland developed a water quality index (WQI) relating conductivity to potable water quality as shown in figure 1 below. (Note that in the Thames basin tapwater has a conductivity of roughly 200 - 300mS/cm while distilled water has a conductivity of about 2mS/cm).
 Streams and rivers in the highland regions of Scotland, Wales and south-west England
generally have very low conductivities since the rocks and minerals in these areas
are not very soluble in water. For example, in April 1992 the conductivities of two
streams on Exmoor were found to range between 53.2 and 62.7 mS/cm. Thus, such waters
are said to be ‘soft’ and their danger lies in the fact that not only do they contain
very little dissolved material but they are often acidic as well and should they
be abstracted for drinking water then they can dissolve metals such as lead and copper
from pipework. As a result, piped water in these highland areas is normally ‘hardened’
by the addition of lime. This has the effect of adding calcium salts which make the
water less acid and increase its conductivity.
Streams and rivers in the highland regions of Scotland, Wales and south-west England
generally have very low conductivities since the rocks and minerals in these areas
are not very soluble in water. For example, in April 1992 the conductivities of two
streams on Exmoor were found to range between 53.2 and 62.7 mS/cm. Thus, such waters
are said to be ‘soft’ and their danger lies in the fact that not only do they contain
very little dissolved material but they are often acidic as well and should they
be abstracted for drinking water then they can dissolve metals such as lead and copper
from pipework. As a result, piped water in these highland areas is normally ‘hardened’
by the addition of lime. This has the effect of adding calcium salts which make the
water less acid and increase its conductivity.
It would appear then that the higher the conductivity the higher the concentration of dissolved material and the better the quality of the water: but this is true only up to a point. According to figure 1 maximum quality occurs at a conductivity of about 127 mS/cm, thereafter it declines. If that index was to be applied to tap-water in the Thames Basin then what emerges from the taps has a quality of between 50 and 90%. However, it must be stressed that when considering the quality of potentially potable waters account has to be taken of a range of parameters and conductivity on its own is not a reliable guide; it has to be looked at against a background of pH, dissolved oxygen, levels of ammonia, nitrate/nitrite, phosphate, suspended solids and faecal coliforms.
As previously mentioned the conductivity of water depends not only on how much solid is dissolved in it but also on the types of ion which are present and it is this point we will consider next.
3. The Relationship Between Conductivity and Dissolved Material
In the first instance there is a direct relationship between conductivity and the concentration of dissolved, ionic solids. The higher the concentration of ions the higher the conductivity of the solution. However, when the individual ions are examined it is found that they all do not have the same ability to conduct electricity. Generally speaking the greater the number of charges on the ion then the more conductive it is. Also, with two notable exceptions, the tendency is for larger the ions to be more conductive than smaller ions of the same charge. For example, calcium ions (Ca2+) and sulphate ions (SO32-) are better conductors than sodium ions (Na+) and chloride ions (Cl-) respectively. Similarly, potassium ions (K+) are more conductive than the smaller sodium ions. The two major exceptions to this trend are hydrogen ions and hydroxide ions which have very high conductivities given their small size. Indeed, hydrogen ions have the highest conductivity of all those ions normally encountered in the environment. The only reason these two ions do not have much impact on the conductivity of water bodies is that they are present in comparatively low concentrations; in the order of 1 ´ 10-4 mol.dm-3 or less.
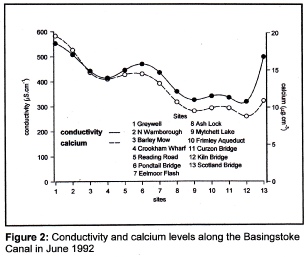 As an illustration of this situation consider the conductivities recorded at thirteen
sites over a thirty-mile stretch of the Basingstoke Canal (Figure 2). All measurements
were taken on the same day in June 1992. It will be seen that values tend to fall
from Greywell, near Odiham in Hampshire, to Kiln Bridge at St Johns in Woking, but
then there is a substantial rise at Scotland Bridge, near the Canal’s confluence
with the River Wey. When compared with the concentrations of calcium there is obviously
a great similarity between the two plots up to Kiln Bridge. Although both conductivity
and calcium concentration rise at Scotland Bridge, the increase in conductivity is
too great to be explained by the higher calcium concentration; therefore, something
else must be contributing to the rise in conductivity at this site.
As an illustration of this situation consider the conductivities recorded at thirteen
sites over a thirty-mile stretch of the Basingstoke Canal (Figure 2). All measurements
were taken on the same day in June 1992. It will be seen that values tend to fall
from Greywell, near Odiham in Hampshire, to Kiln Bridge at St Johns in Woking, but
then there is a substantial rise at Scotland Bridge, near the Canal’s confluence
with the River Wey. When compared with the concentrations of calcium there is obviously
a great similarity between the two plots up to Kiln Bridge. Although both conductivity
and calcium concentration rise at Scotland Bridge, the increase in conductivity is
too great to be explained by the higher calcium concentration; therefore, something
else must be contributing to the rise in conductivity at this site.
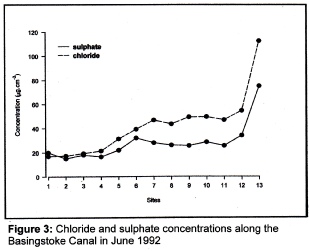
When the concentrations of other material in the Canal are examined two ions stand out; these are the sulphate ion and the chloride ion. If we say that the chloride ion has a nominal conductivity of 1 then the calcium ion and the sulphate ion have conductivities of 1.5 and 2 respectively, so the sulphate ion is the most conductive of the three. Now, inspection of figure 3 shows that the pattern of chloride and sulphate concentrations is the reverse of that of calcium, being low at Greywell but increasing as the Canal flows towards the River Wey. Interestingly, the concentrations of both chloride and sulphate virtually double from Kiln Bridge to Scotland Bridge and it would appear that it is this which is largely responsible for the increase in conductivity at Scotland Bridge. Thus it pays to be very careful when trying to interpret conductivity data.
 4. Soil Salinity and Conductivity
Saline soils usually occur in coastal regions and arid and semi-arid areas. However, they can be found also at inland sites in temperate regions where there are deposits of fossil salts (those remaining at the sites of ancient seas and lakes). In these cases the salinity normally arises naturally but it is possible for salinity to be anthropogenic in origin, primarily as a result of irrigation projects. In the United States alone 5 million hectares of irrigated land are estimated to be salt-affected and world-wide the figure rises to about 70 million hectares.
The soil salinity in coastal areas is the result of precipitation. Raindrops form around crystals of salt in the atmosphere and carry them to earth. In fact the concentration of salts in rainwater can be as high as 50 - 200 mg.cm-3 near the coast. In arid areas salts are continually being released from rocks and soil minerals as a result of weathering. This can increase the salt concentration of slowly percolating waters by about 3 - 5 mmol.dm-3. In the case of irrigation, the concentration of material is low in the water applied to the land, but passing the water through irrigation channels increases its surface area so that its rate of evaporation is increased. As the water evaporates so the dissolved salt concentrations increase. This type of process has badly affected areas of California and in Australia it did cause an increase in the salinity of the Murray River and its riparian environment as water taken from the river for irrigation led to salinization on the land. Subsequent leaching then carried concentrated salt solutions back into the river.
The presence of increased salt levels in soil has important consequences for agriculture and the most common way of checking soil salinity is to take conductivity readings. Measurements are made on the liquid extracted from a paste of soil and distilled water and the results compared with a scale such as the following:
5. Measurement of Conductivity
The apparatus used for measuring conductivities comprises a dip-cell containing a pair of electrodes attached to electronic circuitry for measuring resistance and calculating conductivity. This in turn is connected to a meter having either a moving coil or a liquid crystal (LCD) display to show the conductivity. There are many portable instruments available which are battery-powered. They are simple and quick to use in the field.
Before use the dip-cell should be rinsed thoroughly with deionised water and carefully blotted dry with tissue. That done, the cell is immersed in the sample, making sure that the electrodes are fully immersed, and the sample stirred to dislodge any air bubbles which may be attached to the electrodes’ surfaces. The display will then show the conductivity of the sample.
A conductivity meter must be calibrated before use with a solution of known conductivity. The calibration solution is usually a 0.01000M (0.7456g KCl.dm-3) solution of potassium chloride and its conductivity at four different temperatures is shown below:
The procedure for calibrating a conductivity meter is as follows:
Immerse the rinsed and dried probe in the calibration solution.
Allow the probe time to come to the same temperature of the solution.
Measure the temperature of the solution.
Adjust the meter readout so that it displays the conductivity of the solution at that temperature. For example, if the temperature of the standard potassium chloride solution is 20°C then the display must be adjusted to read 0.001278 S.cm-1, or 1278 mS.cm-1.
Since conductivity increases by about 2% for every °C rise in temperature, it is important for the comparing of results that the calibration solution and the samples are all at the same temperature when measurements are made. This can be achieved in one of two ways. First of all, by thermostatting the calibration standard and the samples; usually at 20°C. Secondly, and this is now standard on most modern, portable instruments, temperature correction/compensation can be applied. The instruments are programmed to apply this automatically, so that whatever the temperature of the sample the value recorded is the conductivity of that sample at the temperature of the calibration solution. Thus if the instrument was calibrated at 20°C then the reading recorded for a sample at say 15°C will be the conductivity that the sample would have if was at 20°C. Again, for comparing results over a period of time a conductivity meter should be calibrated at the same temperature every time it is taken out into the field. To comply with convention the calibration should be performed at 20°C so that all results are the conductivities at 20°C.